Examples of ICT and non-ICT work during University
Painting for a purpose
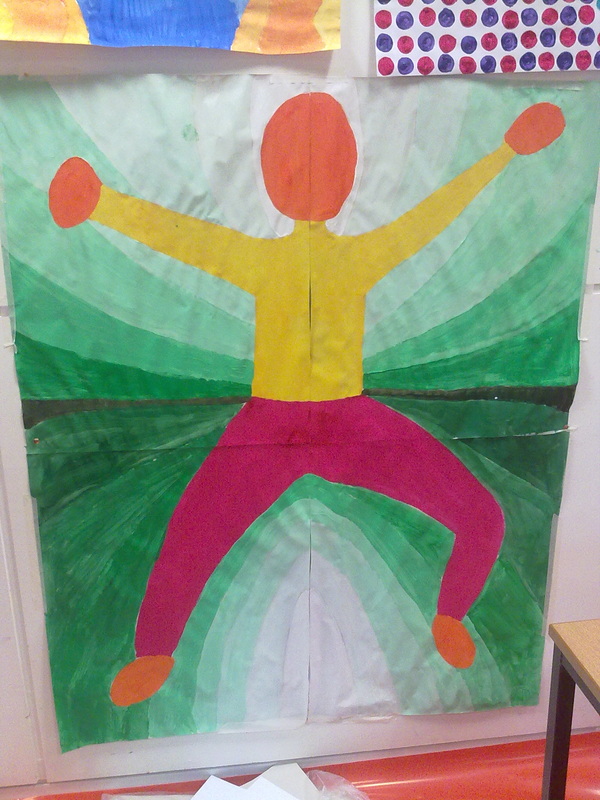
In groups of 4 we were set the challenge in an Art lesson to create a piece of artwork which represented the theme of being healthy. We were encouraged to think about the connotations of health (physical, emotional and mental) and represent them in a picture. Additionally the choice of colours had to reflect mood.
Analysis of our picture:
Analysis of our picture:
- We chose to show somebody jumping; full of life and happiness.
- Red for the legs: to represent energy as it was from the legs that the person was able to project upwards.
- Orange for head: happiness mentally but it is also a pastel orange to show serenity
- Green background: Green is a calm colour and we used different shades to show the range in energy coming from the person. it was also a good contrast to the colours of the body
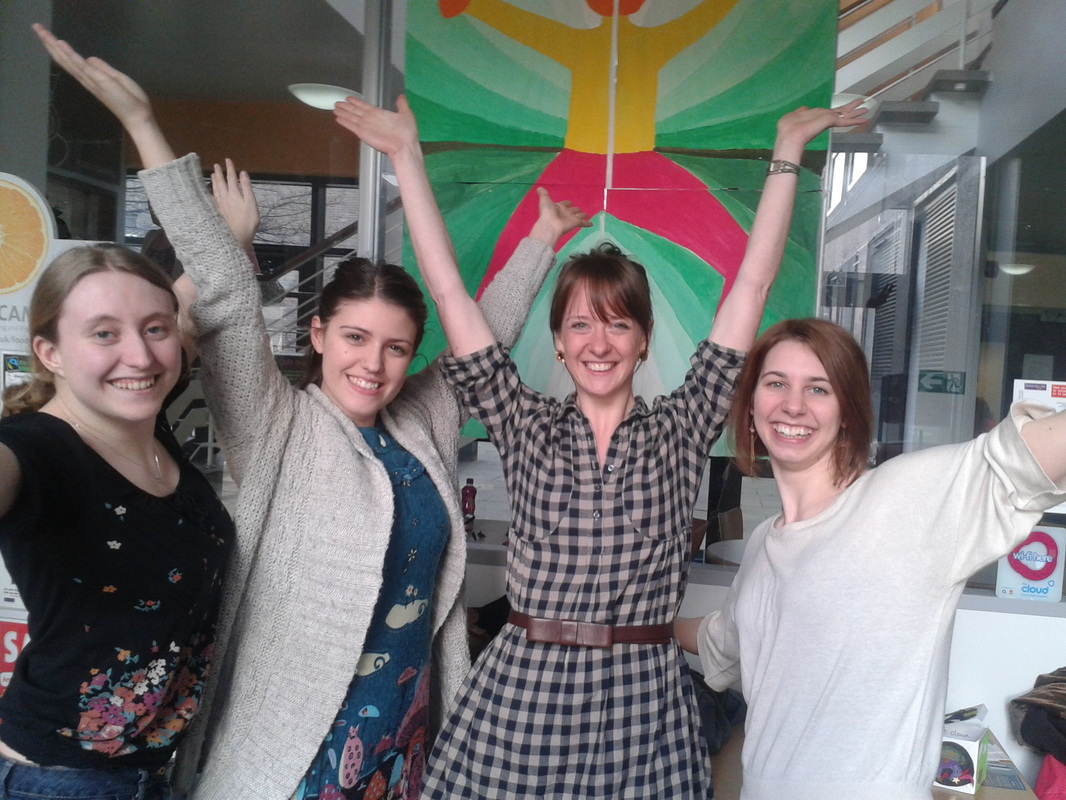
My group: Emma, myself, Laura and Hayley.
Very proud of our piece of artwork which now in the entrance to the Ellen Wilkinson Building.
This activity was enjoyable and educational. It taught team work skills as we all had to agree on a design and complete the picture in the amount of given time. Additionally it really made me think about the impact colours have and how they can reflect a mood. We took a long time discussing the various colours we could used and the interpretation a viewer would take. This activity would be great for children but they would need a much longer time. However, this is a cross curricular activity as it incorporates Speaking and Listening, designing and then making the Artwork.
Powerpoint presentation for statistics
During Theme Week we recorded results to 6 different p.e. tasks and then collated the information. We then had an ICT lesson in which I:
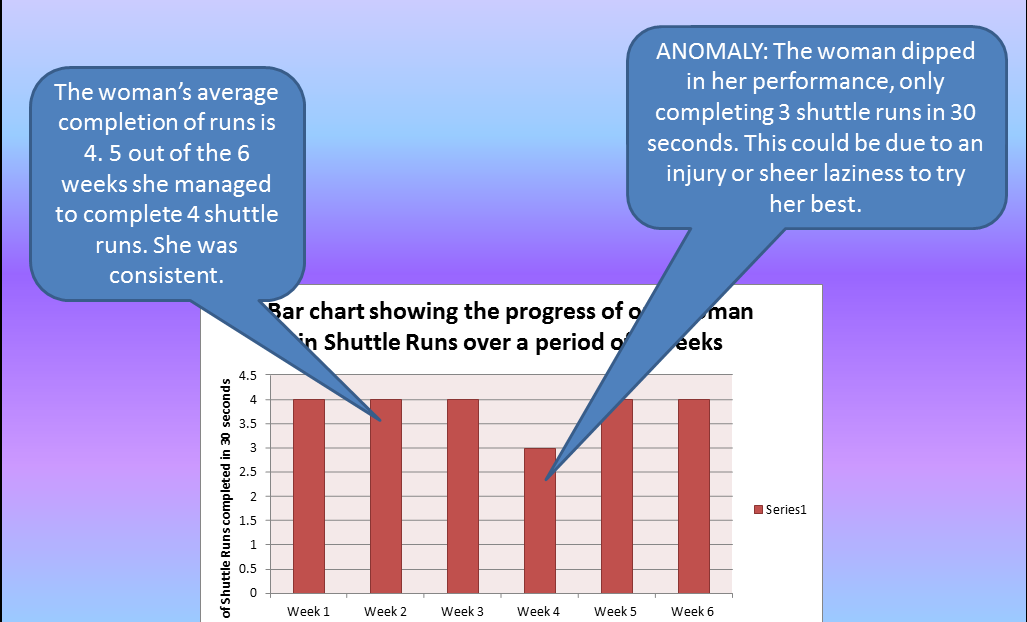
- made a bar graph to show the data of how many shuttle runs a person can do in 30 seconds. I labelled all the axes and put a title on the graph.
- read the data and came to a conclusion
-presented findings on a powerpoint making it engaging and informative
The power point can be viewed by downloading the file below.
| data_handling_12_jan.ppt |
Analysis of Powerpoint
Powerpoint can be really effective as it visually shows information to children. Powerpoint is often overkilled by teachers as it is the only thing they can use. Smartboard and Promethian both have the capacity to do powerpoint and there is the ability to annotate on the slides. Therefore as a trainee on GPP I tried to stay away from using Powerpoint.
Powerpoint however is GREAT for children to use to build up their ICT skills, especially when done in a cross curricular way. As can be seen from the example, upper KS2 children could analyse data and put their results on a slideshow. Assessment could be done this way but collecting in the children's slides and looking at their interpretation of the data rather than just reading it in their books.
Powerpoint is very easy to use and could be introduced in Year 2/3 with children creating picture slideshows. These skills then can be built upon each year resulting in Year 6 with children presenting a powerpoint to the class about a project etc.
